If you’re an investor who wants to maintain some positions with stock picks, then these trading tips may prove helpful. But take care not to trade money that you can’t afford to lose.
Times have definitely changed in the investing world. Many years ago, before computerized trading was a possibility, an argument was easily made that investing on fundamentals and very little chart reading could lead to successful returns. Even today, many investors wave off the charts in favor of fundamental analysis. One of their arguments is that stocks are based on companies. The way companies are run should give you some idea on how their stocks are faring.
The Technical Analysis vs Fundamental Analysis Debate
Keep in mind that the stock market technical analysis vs fundamental analysis argument will come to an end about the same time as the PC vs. Mac debate (these are along the lines of religious debates). These matters have been argued for decades and the only thing that is for certain is that in the end, it’s all about the returns. Take a look at your online broker accounts and the returns they’ve been earning. Is your system working?
To illustrate this point, answer this question: How much of the daily volume is traded using purely technical analysis? The answer is 70% and rising! The reason for this is because 70% of all stock trades in the United States is computerized. A computer system doesn’t care who the management team is. It doesn’t care if a company has a new product coming out, if a drug fails to gain FAA approval or if there are any other newsworthy events that a human trader would find interesting.
To be fair, fundamental analysis includes a look at the balance sheets, P/E ratio and other metrics. But often, computers are made to analyze price action alone. For this reason, we can conclude that a large portion of the price action in a particular stock is the result of a computer, so it helps to think like one.
Charts are a graphical representation of the raw data evaluated by computers, and for that reason, it’s a good idea to take the same stance. So consider making technical analysis a part of your strategy (for the active part of your portfolio; preferably, it should also be a pretty small part of your assets).
Identify A Flat Base Chart Pattern For Stock Trades
Let’s examine a stock chart pattern that you can spot without having a lot of technical analysis know-how. Let’s look at the flat base pattern.
A flat base is a prolonged period of time where a stock trades with low volume and in a very tight range. The base doesn’t have to be perfectly flat, but you should be able to draw a straight line across the area of the tight trading range. Here’s a theoretical illustration:
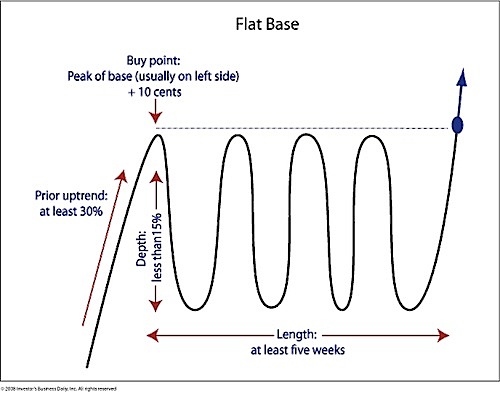
Image from Investors.com
Now let’s check out a real life example.
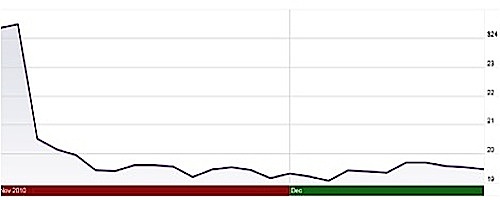
The above example is Cisco (CSCO). For those familiar with CSCO in November of 2010, we know that they had a severe earnings miss and as a result, saw a very large sell off. Like many stocks after a big event, CSCO has spent some time resting.
What happens after the base pattern is great news for the investor. Often, the stock begins to trend up and gain steam along the way. It may not go straight up but when you look back on a flat base, you will often see a very pronounced uptrend. Did that happen in the case of CSCO?
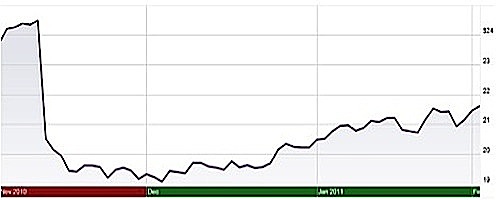
As we can see, it did happen. Since the flat base was formed, CSCO has added nearly $2 to its price (from a little over $19 to around $21 and change) which translates to a healthy gain for the investor who recognized the base pattern. As a trader, how should you play a flat base pattern?
Our Cisco example is a very short flat base pattern and for that reason, a trader should normally look for a longer duration base. In general, a base pattern of 2 months is a strong indication. Once you identify a stock that has set up a 2 month flat base, draw a straight line identifying the top of the base pattern. When the stock closes above that level, open a small position. The stock may be poised to go up.
If it ends up going back down to close below the top of the base, then close your position. But as long as it stays above the top, hold the position. Some stocks will break the top of their initial base and begin forming another base that’s slightly higher. If this happens, sell the position and collect your small gain.
Remember that trying to blindly time a stock’s movement is often a losing proposition. All you can do is watch the signals and respond to them. If they follow their historic patterns, it is likely that you’ll make money. If their moves are less predictable, then make sure that you set your stop limits to minimize your loss.
Copyright © 2011 The Digerati Life. All Rights Reserved.

{ 1 comment… read it below or add one }
Thought this was interesting — not many readers here may use technical analysis, but some of these theories and strategies do pique my interest. Better some form of analysis than just trading without thought (which is what a lot of people I know actually do!).