If you’re old enough, you may remember head and shoulders. That creamy light blue shampoo was the hair product of choice for people who had a problem with dandruff. Who could forget those commercials with the otherwise good looking people with the little white flakes on their shoulders. Head and Shoulders is still around today but hardly the shampoo of choice that it once was.
 Can you spot the Head and Shoulders pattern above?
But that’s not the head and shoulders that we’re talking about. If you’re an active investor or trader, and have spent enough time studying technical analysis and charts, then you’ve heard of this particular chart pattern. The head and shoulders pattern may be found on certain stock charts, and any good stock chartist (or chartologist?) knows that this is one of those chart patterns that can’t be missed. If you miss it, it could have consequences for your trading game, so let’s learn how to spot it.
Scoping The Head And Shoulders Trading Chart Pattern
This pattern is one tool you can use to decide entry or exit points into a stock, and it can indicate a stock trend reversal (note that there’s also such a thing as an Inverse Head and Shoulders, which occurs when you see this pattern upside down). Once the pattern has played itself out, the stock trend marks a shift and points to a reversal. While it’s a technical tool that traders use, it may be worth knowing about if you simply wanted to keep an eye on how your stocks are doing. It can give you a feel for near term price fluctuations and behavior — in case you ever decide to make a move on an investment. So let’s go ahead an scrutinize this image closely:
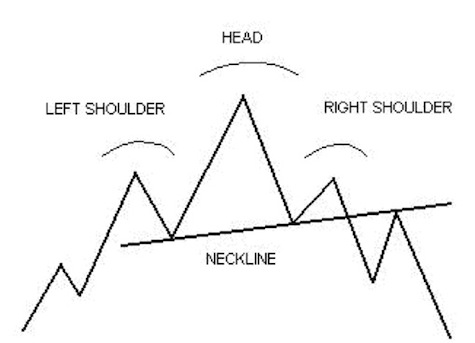 The Head and Shoulders Chart Pattern
Let’s Start With The Left Shoulder
When the forces of supply and demand cause a stock to drop to low levels, we refer to the stock as oversold. Although there is no reliable way to know when a stock will head back up, at some point, buyers will show up and begin buying in force. (Remember our article on the flat base chart pattern? A stock probably forms this pattern before a head and shoulders eventually develops). Once the stock sees a large amount of buying and the price sees a substantial move up, investors will take profits. In the chart above by ChartPatterns.com, this is demonstrated by the left shoulder section.
Notice that the declining part of the left shoulder reaches a bottom. This is called the neckline, and will become very important as a trend line.
The Head
Once the stock declines to the bottom of the left shoulder, buyers expect that the stock will move even higher, so once again, they’ll begin buying the stock and start pushing it up to new highs. This is the head portion of our pattern and it represents the top of the pattern.
Once you notice that a head has formed, it’s a signal that it’s time to dump the stock. This is, of course, an indicator that serious chartists will heed, but may not be of significance to more long term investors who ignore chart movements. Nevertheless, if you’re following a stock’s movements this closely and if you’re really aggressive, then once you see the head forming, it may signify that this is the time to short sell it. This is a technique for advanced investors which should be avoided until you get a firm understanding of the basics. Without the gift of hindsight, how do you know that the top of the pattern is in place? We’ll look at that later.
In the above example, this is a large left shoulder indicating that a head may be close. It’s possible that many smaller looking shoulders may form before the real left shoulder is made.
Right Shoulder
As the stock forms the head, a lot of selling could take place. This is because the stock may have run up in value so fast that investors want to take profits. This causes the stock to retreat quickly. It’s sometimes hard to say when the selling will end, but the bottom is the beginning of the right shoulder and it forms the second point of our neckline. The rest of the right shoulder is formed when investors once again step in to buy the stock. By this point, the stock is expected to be at oversold levels, and investors test the waters to see if there is another new high left in it. If it fails to reach the top of the head, you can expect investors and traders to get back to selling off the stock, thereby collapsing the stock price further.
The Neckline
The neckline is formed by drawing a straight line that connects the two bottoms of the head. This is extremely important because it becomes a key support and resistance level for trend followers. Notice that in the example above, when the stock sells off from the top of the right shoulder, it subsequently becomes oversold and investors start buying again. The pattern repeats and it runs back up to the neckline, followed by more selling later. The pattern is complete when the stock breaks down below the neckline. The stock is now in a confirmed downtrend and should be avoided for the near future.
Keep Your Eye On Volume Too, Not Just On Price Movements
People who read charts understand that volume is the lie detector test. If big volume isn’t there, then don’t trust the picture. When the stock is moving higher while forming the left shoulder, there are a lot of excited buyers that cause an increase in the buying volume. When the head is formed, buyers are now less excited, so the trading volume diminishes. This is why we may get a large selloff, where the stock is unable to carve out a new high, thereby causing the formation of the right shoulder.
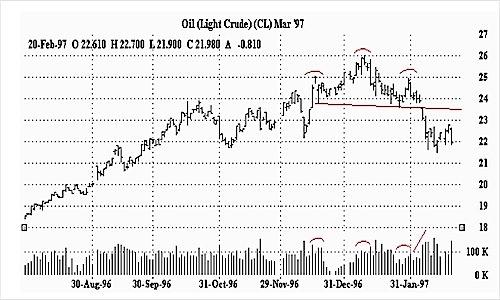 Light Crude Oil Chart Showing Head and Shoulders Pattern
As one can see from the light crude oil head and shoulders chart above, not all patterns are easy to spot. If it weren’t for the labels, would you have found this pattern in the chart, and are there other places where you could spot one if you looked hard enough? Remember that the head and shoulders pattern signifies a short or long term top in the stock. When you see a left shoulder form and the stock sells off and rallies back above that left shoulder, be careful and watch the volume. When it starts to dry up and the stock looks like it’s getting tired, it might be time to take profits and wait for it to head lower.
Copyright © 2011 The Digerati Life. All Rights Reserved.
{ 1 comment… read it below or add one }
I have used this successfully on many trades & volume is the key. However the overall trend plays a huge part in the result.