Here’s another free stock charting tool you can use to chart market trends, check your stocks, track quotes and analyze your equity portfolio.
I’ve been investing in the stock market for some time now, but can only call myself a “lazy” investor. I can certainly do a better job with my money and investment management efforts. For instance, I’m determined to spend more time and be more diligent about tracking my portfolio on a regular basis.
As for checking on my equity positions, I’ve been using the available tools from the online brokerages and mutual fund institutions that I have accounts with. I’ve also done tracking via Yahoo Finance, Google Finance and Morningstar. Recently though, I was referred to a free stock charting and market analysis tool from INO.com.
Get Quotes, Check Your Stocks and Chart Stock Market Trends
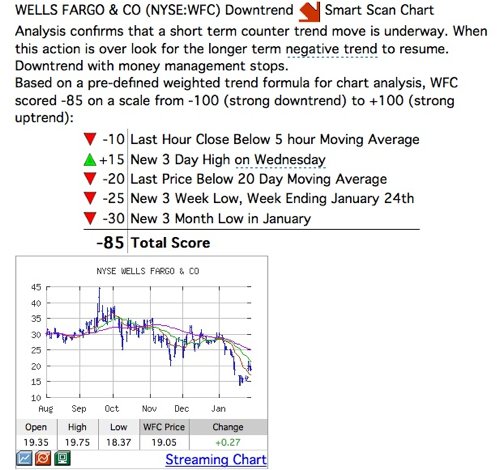
If you haven’t heard of INO.com before, they’re an online company that offers a one stop shop for investors and traders, providing users with a variety of investment tools, email services, educational materials and resources. They’ve got several free channels on their site, including this free stock charting and analysis tool (called Trend Analysis) that delivers a daily email message about the stock symbols you want to track. By supplying your email address here, you’ll receive free trend information such as the following:
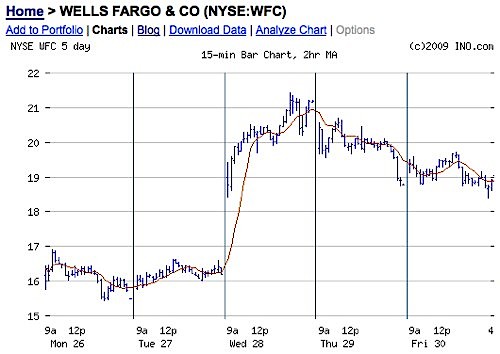
The stock analysis report links to your online portfolio displaying your stock charts:
My Notes On INO’s Free Stock Charting Tool
A few things I noted when I signed up:
- You’ll get a daily trend analysis report so it’s best to use a dedicated email address (or set up a filing system) for INO material, especially if you’re interested in subscribing to free stock reports or signing up to get videos, alerts and messages.
- You may expect the trend analysis report immediately once you sign up (like I did) but it could take a little time to hit your inbox since it’s delivered on a daily schedule. This service is a subscription to an ongoing report, so you can expect an immediate acknowledgment message upon subscribing.
- You can add as many stock symbols to your portfolio as you want via the Trend Analysis tool. The symbols are all sent in one trend report to your email address. You can also access your symbols online through a link on the report that leads you to INO.com’s Portfolio page (also reachable via their home page). Your portfolio contains charts and additional information on the stocks you’re tracking.
-
You’ll receive occasional educational videos through email, covering various aspects of the investment markets.
Here’s a sample video discussing an interesting trading concept called “The Pullback Rule” (click to watch):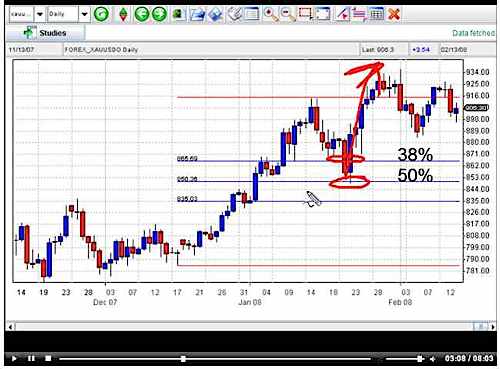
Active traders, investors or those who maintain more dynamic investment portfolios should find this information helpful; as a long term investor, I find this stuff intriguing as it allows me to gain a better perspective and understanding of how the market works.
Market Club Premium Service For Active Investors
INO.com already provides a lot of free materials and information through their site and their free services: INO Free TV (4 free videos), quotes, charts, news and Trader’s Blog, which are helpful to both short and long term investors alike. For the lazy, long term investor such as myself, this may be enough. But for those of you who are looking for more advanced analysis and more sophisticated market resources, INO gives you more options through their Market Club service.
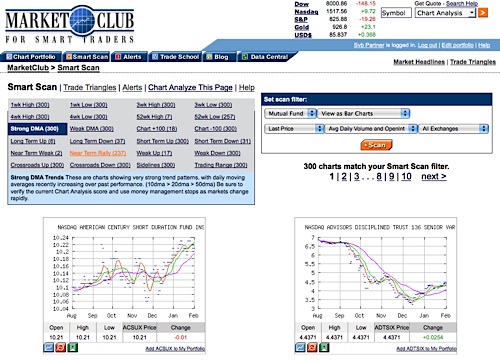
INO prides themselves primarily on their premium service called Market Club, for those interested in heavy duty investment and trading resources. It offers more in-depth features, a great set of tools, plus videos and educational resources for traders. It’s definitely geared towards more active traders or those investors who really want to keep their fingers on the pulse of the markets.
I’ll follow up next time with a review of Market Club’s more advanced tools and features.
Copyright © 2009 The Digerati Life. All Rights Reserved.

{ 9 comments… read them below or add one }
I’ve thought about using my earnings from the Photography business to invest in the market and pick up some battered stocks.
Great post! I’ve bookmarked your blog.
Best Regards!
Ginj
Skip all this and go with index funds. 🙂
Jim,
What I believe you are implying is that we should stick with buy and hold and passive investing, not necessarily index funds.
I am a passive, long term investor, but I like to see and chart my assets — it’s a matter of keeping tabs with my portfolio. I do it just to gauge the health of the market — maybe to even see if it’s time to put my money in the market as a contrarian investor.
Index funds, index ETFs or charting are not mutually exclusive entities. These tools are used for technical analysis, mainly — but it has a use for anyone, whether you index or not, as long as you are thinking of applying technical analysis to your investing.
I’ve used mainly fundamental analysis for most of my investing experience, but have dabbled in technical analysis on occasion. It’s an interesting field. I know many die-hard index investors who use technical analysis as their main method of evaluating the markets.
Thanks for the .02.
it’s good
This seems like a nice tool. I just may have to sign up and give it a try.
Does this tool work for Canadians?
A stock charting tool is a necessity for anyone who dabbles in stocks. Without it, it would be impossible to perform technical analysis which serves as a gauge for determining whether to invest in a certain stock or not. Certainly, free versions of online stock charting tools are good, but I know of a real great stock charting tool called BlastChart (see blastchart.com). This tool is very intuitive and is meant for newbies, traders, and part-time investors.
I also found a very efficient stock charting tool that can also do reviews on market fluctuations along with stock charting at blastchart.com.