I’m an index fund investor. Curious to see how my portfolio’s end-of-year investment returns turned out?
It’s time for me to look into how our investment portfolio did this year. Given our rather simplistic approach to stock investing, it’s easy to see what our rate of return is for the year. For now, I’m just going to give it a quick check by reviewing the charts of our major holdings. We’re big on indexing, so most of our investments in the equity markets are simply divvied up by asset classes covering the total U.S. market, the Nasdaq and the international markets. A small amount was invested in the video gaming sector.
Let’s see how things stacked up.
The following charts show the Vanguard Total Stock Market Index (VTI or “Vipers”), which is the exchange traded fund (ETF) representing the U.S. total stock market in the appropriate proportions for large, mid and small caps.
We’re holding other ETF’s as well such as the QQQQ (the “Cubes”), which roughly represents the technology sector (though other indexes exist that cover technology as well) but more accurately tracks the 100 largest non-financial companies on the Nasdaq, and SPY (SPDR or “Spiders”) which represents the S&P 500 Index which tracks primarily U.S. large companies. EFA is the MSCI EAFE Index covering international or foreign companies.
As I haven’t checked our equity allocations too carefully yet, all I can say is that we’re trying to get our stock weightings close to 75% U.S. total stock market, 15% QQQQ and 10% EFA for a reasonable diversification. I’ve used both mutual funds and ETFs for our portfolio but find that ETFs are preferable to hold because of the convenience of trading intraday. ETFs are but index funds or trusts that are traded intraday on an exchange like regular stocks. They’re great because they provide diversity similar to mutual funds but have lower fees and more flexibility in trading.
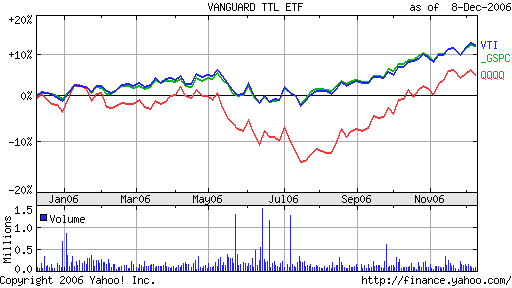
Figure 1: The Vanguard Total Stock Market Index (VTI) vs QQQQ (Nasdaq) vs S&P Index (S&P)
| ETF | YTD Return | PE Ratio |
|---|---|---|
| VTI | 11.82% | 15.03 |
| QQQQ | 5.36% | 23.72 |
| SPY | 12.09% | 15.19 |
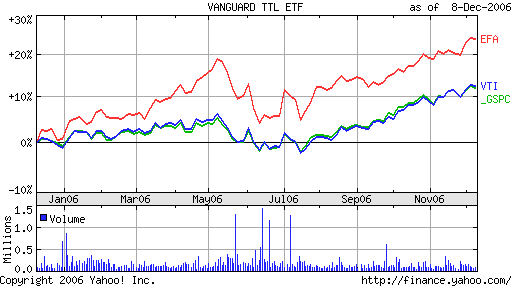
Figure 2: The Vanguard Total Stock Market Index (VTI) vs EFA (International) vs S&P Index (S&P)
| ETF | YTD Return | PE Ratio |
|---|---|---|
| VTI | 11.82% | 15.03 |
| EFA | 18.27% | 14.57 |
| SPY | 12.09% | 15.19 |
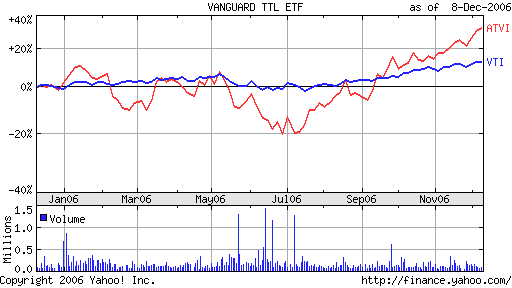
Figure 3: The Vanguard Total Stock Market Index (VTI) vs ATVI (a video gaming company representing the gaming sector)
| ETF | YTD Return | PE Ratio |
|---|---|---|
| VTI | 11.82% | 15.03 |
| ATVI | 28.57% | 194.02 |
It looks like for the year, we did reasonably well given the positive returns above 10% by most of our equity investments. But we also have some holdings in I-bonds and cash equivalents so those weightings will bring down our average returns, but those are there to cushion us from any volatility and help control our risk. So overall, we are fairly satisfied with the performance of our portfolio this year. Interestingly, what’s missing are representation and exposure in some additional real estate apart from our main residence, which we can remedy either by buying REITs or moving some money into depressed real estate properties for investment purposes. However, we’re quite convinced it’s not the right time to buy into real estate as of yet, but when the time comes, it will definitely be a strong consideration for us to mull over.
Here’s hoping that next year will behave as positively as 2006 has! However, I may have mentioned before that I am an intuitive investor, and as I absorb and digest economic, investment and business news and information at this time, my gut feeling about next year isn’t turning up rosy as yet. I am cautiously optimistic about how the markets will behave going forward and as events and financial numbers are rung up, I’ll probably be adjusting our stance accordingly. Nevertheless, it is quite possible that we may take a little bit of a defensive stance and apply some hedging strategies given the outlook on housing and the US currency, but we’ll delve into that once we get our act together.
Copyright © 2006 The Digerati Life. All Rights Reserved.

{ 1 comment… read it below or add one }
I done well investing in and out of DBA, GLD and SDS. Does anyone else hold those?