It’s that time again…
Here’s how a few of my fellow finance blogger friends were investing. This time, it’s my turn! I am also following my own advice here by evaluating our investment portfolio to see how we’re doing at this almost half year mark. To refresh your memory, here’s what our asset allocations looked like at the close of 2006. It appears that very little, if any, portfolio shift occurred in the last 5 months. Though we’re interested in shuffling things around just a wee bit, we won’t do anything until after we review how things stand at this juncture.
The key here is to that we need to keep monitoring our portfolios on a regular basis in order to ensure its health. Determine where you stand in order to plan rebalancing at appropriate times of the year and in order to adhere to your selected asset allocation.
And here’s what we have today…
Our Investment Portfolio Allocation Comparison (December 2006 and May 2007)
| Asset | December 2006 % | May 2007 % |
|---|---|---|
| U.S. Total Stock Market / Non-Retirement | 29% | 29% |
| U.S. Total Stock Market / Retirement | 17% | 16% |
| U.S. Total Stock Market / 529 Accounts | 4% | 4% |
| Nasdaq / QQQQ | 6% | 6% |
| International Equity | 11% | 11% |
| Bonds | 2% | 2% |
| Cash | 26% | 32% |
| Individual Stocks | 5% | 0% |
What you will notice here are these changes:
#1 We redeemed our individual stock in my spouse’s ESPP plan. This has caused the increase in our cash holdings of around 5%.
#2 I had miscalculated this year’s tax liability, causing an undervaluation of our cash position at the end of last year. In other words, just this April, I had earmarked some cash to be paid for our 2006 taxes but it turns out that less than a third of that amount was what we actually owed! Well that was just superb, as that meant we get to keep more in our coffers! So I’ve corrected our cash calculations, causing an increase of 1% in the current levels. All in all, cash went up by 6% since the end of 2006.
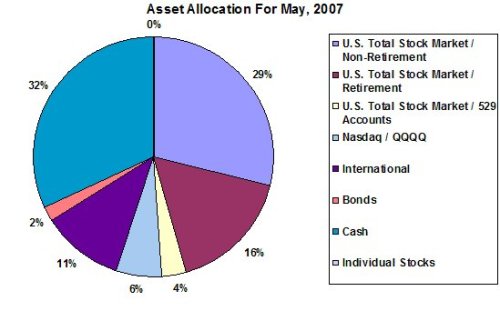
All this bodes good news and healthy gains for our portfolio, leaving us with our current asset allocation as follows:
Asset Allocation For May 2007
For Year To Date results, here’s how our portfolio actually did:
Investment Portfolio Growth From December 2006 To May 2007

Interestingly, the growth for US Non-Retirement funds seems outrageously high, with a 23% gain in the last 5 months. How could this have happened given our primary investments happen to be in index funds? In reality, this is once more a consequence of some inaccurate calculations I had made last year, causing an inflation in the numbers this time. No, I’m not a doofus — I’ve done this deliberately as I confess that I tend to work out our numbers conservatively so as to keep ourselves grounded about our financial status. It’s therefore quite often that I eventually end up revising our accounting upwards, which leaves us usually pleasantly surprised about the growth of our portfolio through time. So this turned out to be one of those opportunities when I had to make such positive corrections. Yay!
Now taking into consideration the appropriate adjustments I had to make, what the growth chart above should actually show is that our portfolio pretty much just tracked the indexes for the U.S. Total Stock Market as well as the international markets, with increases ranging from 6% to 11% for the year. Our international position did quite well by going up 11%. All in all, we are up 13% since I last tracked this portfolio, again for a variety of reasons — not all to do with market returns, as I’ve already mentioned.
It remains to be seen whether this smoking hot stock market and its foreign counterparts will continue their solid advances. Though many fear that this show of strength will wither into a summer pull back, I’ve also read elsewhere that if the market breaks through its previous records, then it’ll continue to soar to new heights. Either way, if you’re a long term investor with a well balanced portfolio, then any of this shouldn’t make a difference to your strategies.
At some point, I’ll be covering our program for making some minor modifications to this portfolio. I’ll be revealing it in the coming weeks; but first, there’ll be much animated discussion on this topic at our household!
Copyright © 2007 The Digerati Life. All Rights Reserved.

{ 5 comments… read them below or add one }
Looks like you really have a very simple portfolio. But how significant is it to have Total Market Fund in all your investments? Sure, with Total Market Fund, you don’t need any other funds to diversify, but would it better if you also add some sector/category funds? The reason I am asking is the asset allocation of the Total Market Fund may not be what you want and adding, for example, a small-cap fund could boost your return without introducing a lot risk.
Hi Sun,
That’s something to consider for sure. We do have small cap representation but it’s in proportion to the entire market, hence I called it a “Total Market” position. From our experience, we feel that we’ve done quite well tracking the indexes and have been comfortable with the given (or lack of) volatility we experience. But we’ll take a closer look at small caps and see if we should be reshuffling a little bit. We have an OTC fund that falls in that category as it is. We may just boost that position a bit.
How has your portifolio fare with the recent brusing on Wall Street? Any chance of a post in terms of cap allocation? Large, mid, small? It seems like you are pretty well diversified but I don’t see anything about Large, Mid, Small or Growth vs Value for that matter?
Has the market hit bottom? It is anyone’s guess, but I’ve been doing very will with EWZ, GLD and DBA. Is anyone else holding those issues?
I’m interested in this too? Has it hit the bottom?