The pages of the Wall Street Journal are full of “major market indexes” (or indices). The lists upon lists of numbers and symbols can seem like a cornucopia of nonsense to the untrained eye such that many investors find that sifting through the index lists can be frustrating. So I thought it would be worthwhile to review the market indexes that fall in the “major large cap category” and consider some of the stocks that comprise each index.
In case you’re unfamiliar with the term, a market index is basically a silo of stocks considered to represent a particular market sector within the larger stock market. Long before I earned an MBA or started investing, I’d heard of the Dow Jones Industrial Average (DJIA). It’s the index that appears to be the flagship for blue chips and large cap equity investments. The major cap is synonymous to the term large cap and is a label used to refer to companies with a market capitalization value of greater than $10 billion.
A Look At The Major U.S. Large Cap Indexes
The investment community considers the DJIA to be a large cap index because it lists 30 large “blue chip” stocks that are associated with the industrial sector (excluding transportation and utility companies). Blue chip is an important concept that most of us have heard before on the news. To say that a company is blue chip signifies that it is nationally recognized, well established, financially sound and has a long record of continual growth. Such a company sells high-quality products or services, and its stock is expected to sustain itself during market downturns and to operate with a profit even when the economy is rough. Many of these stocks are household names, such as Apple, Microsoft, eBay, and Amazon, and may find themselves in a lot of retirement portfolios and even endowment funds.
There are market indices for just about every sector of the economy. Mutual funds and exchange-traded funds (ETFs) are the two most common investment mechanisms used to track the performance of a particular index.
Dow Jones Industrial Average (DJIA)
You’ll find this index to be the most recognizable of all big market cap indexes even as it tracks a relatively smaller set of stocks — 30 blue chip stocks in the “industrial” sector. The index does not include any companies from the transportation or utilities sub-sectors, but includes a wide range of others that are traded on the New York Stock Exchange and the Nasdaq. The DJIA is not calculated using market capitalization techniques (more on that below) but instead, has its own formula using the “Dow Divisor.”
General Electric, Disney, Exxon Mobil, and Microsoft are all included in the Dow. The stocks that the DJIA tracks are so influential that often, when TV networks say “the market is up (or down) today,” they are referring to the performance of the Dow. The chart below shows the index’s performance since 2000.
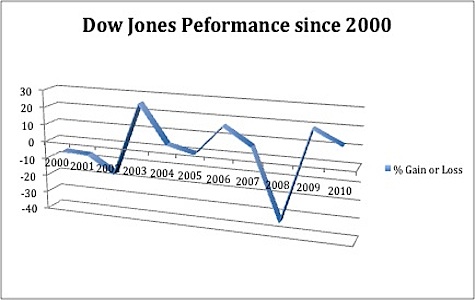
The Dow is considered a very stable index, having lost more than 500 points only six times in 115 years; and if you notice, since the financial crisis, its been gaining lost ground. You can invest pretty easily in the DJIA through its individual stock components, or through mutual funds and ETFs. Open an account with an ETF broker to get started.
S&P 500 Composite Stock Price Index
Let’s compare the S&P with the Dow Jones:
The Differences: You’ve probably heard of the S&P 500, too, but it differs from the Dow in several ways. First, it is a capitalization-weighted index, which means that the index uses a specific market capitalization technique. Market capitalization is calculated by multiplying the number of a company’s outstanding shares by its stock price per share. Second, the S&P 500, as its name suggests, is comprised of 500 stocks intended to be a large sample of leading companies in various industries. To be included in the S&P, stocks must be large cap, and must be representative of the industry in which they belong.
The Similarities: You may also be interested to know that there is one huge similarity between the S&P 500 and the Dow Jones: the stocks in the DJIA are actually all incorporated in the S&P 500. So there is that overlap. If you want to focus on a smaller subset of the S&P 500, then you’ve got it in the DJIA.
The S&P 500 is almost as popular as the DJIA and is a highly followed economic gauge. You can buy mutual funds and ETFs that track and represent this index in many mutual fund companies and brokerage firms. So who’s in this group?
We already know that all the Dow Jones stocks are in the S & P. So what does the latter have that the former doesn’t have? Tyco International, Nordstrom, Amazon.com, Visa Inc., Apple, and Sara Lee are all part of the S&P and show some of the sexier companies (and the broad range of industries) that you may not find in the Dow. It is important to note that companies that do not trade publicly and/or don’t have sufficient liquidity are not on the index.
Over a fifteen-year period, the index has shown stability despite the dot-com bubble and the 2007 sub-prime lending crash. Personally, I’ve long followed the S&P, as I find it to be ultimately more reliable than the Dow (though both are worth following). I prefer the S&P because I appreciate the diversity of companies included in the index, since my own portfolio is diversified amongst sectors as diverse as technology and apparel retail.
Nasdaq 100 Index
The Nasdaq 100 is a large-cap index that constitutes the top 100 biggest and most widely traded American companies on the Nasdaq Exchange. Because the Nasdaq is a diverse platform, the 100 index includes companies from many industries, but interestingly, it does not track stocks of financial companies. Like the S&P 500, the Nasdaq 100 is weighted by market capitalization.
In order to set themselves apart from other market indexes, the 100 has developed a set of standards that must be met for a company to be included:
- The stock must be listed on the NASDAQ in either the Global Select or Global Market tiers.
- Must typically have been listed for at least two years.
- An average daily volume of at least 200,000 shares.
- The company must produce up-to-date quarterly and annual reports.
- And it must not be in bankruptcy proceedings.
The companies list on the Nasdaq 100 include Bed Bath & Beyond, eBay, Google, and Yahoo!. Now in addition to bypassing financial companies, you may be surprised to discover that the Nasdaq 100 includes some companies that are based outside of the U.S. There are 5 foreign companies in the S&P 500 as well, but the DJIA is pure American.
This chart shows the Nasdaq 100’s performance over the last 5 years. You can see how rough it got in 2009, but this was the case for the equity markets during that time period. While the 100 index is relatively stable and high-yielding, it can still be volatile during certain periods.
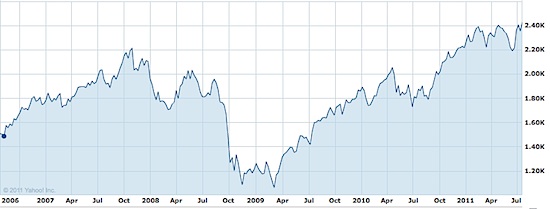
Investors can purchase ETFs and mutual funds to follow the Nasdaq 100. The QQQ is the most popular of these but there are other options which we’ll get into in another article.
Comparing the Big Three Large Cap Stock Market Indexes
All of us can benefit from following one or all three of these large cap market indexes. But which to choose? As you’ll see, it ultimately comes down to personal preference. This graph compares the performance of the Nasdaq 100, the DJIA, and the S&P 500 since 1975.
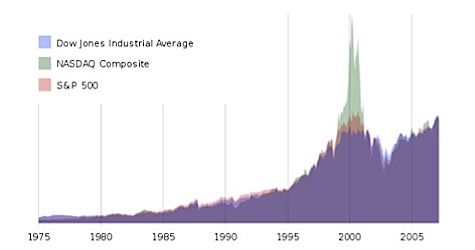
Despite a burst for the Nasdaq in the early 2000s, all three major cap indexes typically follow similar patterns. As mentioned, I find the S&P 500 to be easier to understand and more beneficial to my diverse portfolio. However, if your portfolio is more concentrated, the Dow may be a better option for following trends or even for investment through an ETF.
As a final thought, keep in mind that a large-cap index serves two purposes:
(1) it helps us understand general market trends; and
(2) it is also an instrument for investment (after all, they can be traded), but unlike other instruments, an index derives its worth from its divergent stock components.
Created March 25, 2009. Updated July 24, 2011. Copyright © 2011 The Digerati Life. All Rights Reserved.

{ 3 comments… read them below or add one }
@SVB – Nice work putting this together. Indices are quoted everyday, but few understand the underlying components. What is interesting if you’re a stats nerd (guilty) is the DJIA with only 30 stocks has done exceptionally well at tracking the broader market as measured by the S&P 500. Even with that in mind, I still favor the S&P 500 over any other large cap index though major media is unlikely to stop quoting the Dow anytime soon.
Oops…nice work Mr. Bradley.
@Michael,
That’s great, I work closely with the “Digerati writing team” so you can address any of us! 🙂 I also favor the S&P 500 over the DJIA, and in fact, I tend towards the larger indexes. So while I used to have the S & P in my portfolio, I swapped it out for the “Total Market Index” funds which may actually cover an even broader basket of stocks that encompass the entire market. Some people may prefer breaking down their portfolio into large cap/mid cap/small cap components, but I prefer to do it the easy (lazy?) way by just using a Total Market Index.
In the past, I used the S&P to represent the market as a whole, but it sounds like these big indexes go in lock step and are so strongly correlated that they can almost be interchangeable. For example, what does it buy you if you have a fund tracking the “Wilshire 5000” as opposed to the S&P 500?