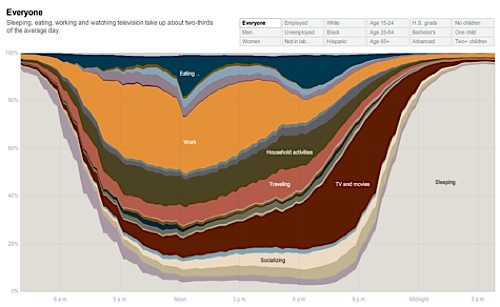
I just love this kind of thing: have you seen the interactive graphic from the NY Times that details how different demographic groups spend their day? Since time is money (or so they say), actually seeing a visual of how we spend our most precious resource is truly enlightening. This colorful graphic is based on the American Time Use Survey which pooled together the information gathered from thousands of Americans. Here’s a little sample of how the graphic looks (you can click on the image below to check out details of the survey and to see how the interactive graphic works):
Time Is Money: How Do You Spend Your Day?
The emphasis here is on how the nearly 1 in 10 unemployed people in America are spending their days compared to everyone else. But behind the colorful presentation, there are a few other interesting findings you’ll garner from this study:
- The unemployed catch up on more sleep than those who are employed (one more hour of sleep at night — that’s a lot!). As expected, they’ve got more time to spend on other activities to fill the vacuum abandoned by “work”.
- Relative to women, men devote more time to work but also dedicate more of their day to eating, drinking and entertainment by watching movies and television.
- People of different racial backgrounds also show differences in their daily schedules.
- Not surprisingly, people under the age of 24 spend more time sleeping than everyone else, while people over 65 trade in their work hours for TV and movie watching, thinking, relaxing and other leisure activities. And you may or may not find this surprising: younger people travel more than older folks (those over 65) — I thought retired folks lived for travel!
- There’s not much difference between how a college graduate and someone with an advanced degree spends their time.
- There’s not that much difference between a one child family and a family with two (or more) kids. But going from no kids to one kid will require bigger adjustments to your lifestyle. Also, people with bigger families work more hours and have fewer leisure activities than those without kids. Well, that’s expected!
So how much of your time is spent at work? At play? Or asleep? If I plot my time, I think the orange work area will occupy quite a huge chunk of my daily chart.
Copyright © 2009 The Digerati Life. All Rights Reserved.
{ 10 comments… read them below or add one }
I’m surprised at how low the percent of people using the computer is. Personally, I use the computer a LOT more than the TV. I realize that I’m not particularly representative of the population as a whole, but I’ll still surprised at the difference. I guess I must be missing out on all those great TV shows 🙂
I wrote a tongue-in-cheek article about sleep a while ago — check it out.
It’s funny to see the differences in how you spend your time. I bet it changes so much depending on where you live in the country. I bet that is the biggest factor more than anything.
What I find amazing is how much time is spent watching TVs and movies but people constantly say they don’t have the time to start a side business or work on improving themselves.
It would be very nice to have the actual data behind that graph. I would love to see how it breaks down in finer detail. Such as comparing employed men with bachelors degrees and no kids compare to the same group that has kids.
We all have the same amount of time. Time management typically focsuses on being more efficient. What we should be working on is how to improve our energy management. How to focus our energy on the projects that truly make a difference in our lives.
Great information and graph!!
It would have been interesting to see the graph break down how people at different income levels spend their time throughout the day. I would bet that those in a higher income bracket spend more of their time performing tasks that either got them where they are at or would get them further up the income ladder than those that would be categorized as middle income or poor.
Wow, that chart thing is addictive. Really fascinating–though I have to agree with Kosmo, above, about computer use. If you count work as well as home use, then probably 80% of my waking hours are spent on the computer (at least Mon-Fri).
I’m writing a series on what to do when you lose your job, and I think it’s great to hear that unemployed folks are sleeping more and doing housework. People who expect them to be job-hunting for 6 hours a day are out of touch with reality. Besides, we all ought to sleep more and take better care of our homes and ourselves– I liked that this NYT article respected those activities. I can just see how Fox would spin this: “Unemployed watch 490 more minutes of TV than the average working American!” Groan.
@ Scott Lovingood – Yes, it’s amazing what people could accomplish if they watched less TV. I never did watch a huge amount of TV, but I cut down what I watched so that I could write (for my blog and for a couple other projects). As soon as my daughter goes to sleep, I’m at the keyboard writing (unless, of course, there is housework to catch up on). I spent about a decade neglecting my writing before someone mind me aware of the (obvious) fact that I could get immediate feedback via a blog!
@ Frugal New Yorker – They can’t possible be including work use of computers, can they? I’d find it surprising that only 1-2% of the population is behind a computer at any point in the work day. I suspect that they’re putting each activity into only one bucket – in this case, work.
Good stuff.
@Kosmo,
This may be surprising, but I’m one of those people who spend quite a bit of time watching television. In between doing chores, managing kids and working, I sneak in my reality television shows (big fan here) and get my guilty pleasures fulfilled that way. That’s pretty much all the entertainment I get (well okay, the computer helps too). Since I work from home, I find the mindless fun from the tube enough to keep me productive for the day. Yeah, I know, different strokes for different folks.
@Paul,
I agree with you — it would indeed be interesting to see how different income groups do spend their time. Let me take a shot: I’m going to guess that most financially successful people spend an inordinate amount of time on tasks that have gotten them successful. But I bet that the happiest people are those whose days appear the most balanced.
I know TV is a big one but its pretty crazy how much time we spend eating. I guess some people really enjoy eating. I find it to be a time suck. I wish I could just take 3 of those pills like the Jetsons. It’s not just eating but either A. cooking B. traveling to go eat. And we have to do this three times a day. I wish I could eat the occasional once a week meal with friends and skip the others.
A very nice investigation, what I could never ever believe is that the youngsters travel more than the retired…What else to do when you’re not working and not so keen on sleeping and entertaining? But what to do, when you’re unemployed at 24? Does the survey cover the time they spend going to interviews and sending their CVs?
Well, what also really interests me, is the difference in the day spending of representatives of different races and religions? This aspect was left almost uncovered. And finally, I’ve always thought that statistics is an exact science, we don’t know the exact number of the surveyed. And finally, can’t help asking about computing, like all the people above, I guess it should take one of the first places and here the differences between male and female, white and black, young and old are not that much great, computer to some extent unifies us.
Wow, that’s an awesome little graph. It’s amazing to actually look through how the different groups differ in how time is used.