For those of you about to make a stock transaction, do you ever wonder if it’s the right time to pull the trigger? We all have different ideas about stock market timing, but it may be interesting to get some perspectives on how some people invest. While some of us don’t bother with technical signals, others live and die by it. Since the financial crisis, I’ve stepped up my studies of the investing and trading world, partly out of curiosity and partly to see how others may have been able to sidestep or even to capitalize on the volatility of the past two years. Let’s see what Tim P., our resident stock trading enthusiast has to share with us today.
I’d like to reveal one of the successful approaches I’ve been taking in order to make money in the stock market. Of course, your mileage may vary, but I’m only giving you my experience. Now before I do, I’d like to offer a disclaimer: we’re here to discuss various investing and trading techniques for educational purposes only and for the purpose of igniting ideas. Every strategy we introduce here always requires further due diligence.
No one piece of information is enough to justify a trading decision or a decision to commit real money to the markets. The reason that 80% of retail investors don’t make money in the stock market isn’t because it’s rigged or because it’s too complicated. The real reason is that the bulk of those 80% come to the market as if they’re going to Vegas to hit a jackpot. They gamble in the stock market and bank on their emotions to get them by, instead of acting on knowledge, prudence, patience and careful research.
How To Employ Trading Techniques
First things first. Any trading strategy you hear about shouldn’t be used on its own as the only thing that should drive your decisions. Find 5 other good reasons to purchase a stock, then think about this additional strategy as a supplement to what you’d like to do. This approach alone (as is the case with other techniques) should not be the lone reason to buy a stock. What this piece of information can do is to help you pick your entry and exit points.
Before I explain further, we need to look at technical analysis. Pure technical analysts don’t look at real world company facts. They aren’t concerned with the fact that it’s cold outside so natural gas should rise in value. They’re also not concerned with the fact that China is buying more than they ever have. No, technical analysts only look at charts.
Most highly successful active investors or traders aren’t purely technical analysts nor purely fundamental analysts. They mix both approaches. Maybe the technical person looks at the chart but backs that up with real world data like the P/E Ratio. Fundamental traders look at the balance sheet and the news surrounding a company, then use the chart to find an entry or exit point. This is basically the approach I personally take with my own trading activities. Here’s more on stock market technical analysis vs fundamental analysis.
Exponential Moving Average As An Effective Trading Tool
So here’s where I introduce the idea of using the exponential moving average for analyzing and identifying trading points. The simple moving average, which all basic technicians learn about, is the average stock price over a certain period of time. Equal weight is put on all days.
The exponential moving average is similar but it adds more weight (importance) to the latest closing prices. In other words, yesterday’s close is more important in the calculation than last month’s close. You can pick the number of days which you can review. Any number of days is fair game but if you want to make this helpful, you have to know what the big money people look at.
Hedge funds and mutual funds set their stops based on certain technical indicators, and because of this one fact, the one we want to look at is the 50 day exponential moving average. When you evaluate a stock, this is one of the charts you should pull up. Let me show you a couple of examples of how this works:
#1 Deere (DE) Stock Chart

Deere Stock Chart with 50 EMA
This is a chart of Deere (DE) with the 50 Exponential Moving Average (EMA) laid over it. Notice that in late November 2010, DE dropped down and touched its EMA of $74.70 and has been on a tear since. The 50 day EMA here is recognized as “support”. If you purchased this stock when it hit the 50 day EMA, you would have made a lot of money in a small amount of time.
#2 Bank of America (BAC) Stock Chart
Let’s look at another:
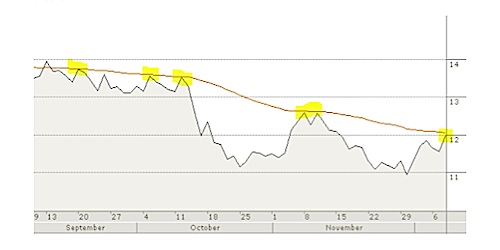
Bank of America Stock Chart with 50 EMA
Take a look at this chart of Bank of America (BAC). From September until early December, BAC hit its 50 day EMA at least 6 times and immediately headed south. There are other reasons for these moves that also involve the 50 day EMA but for now, notice that large scale investors are paying attention to the 50 day EMA and so as an active investor, you should probably do so as well. In this case, the EMA is recognized as “resistance”.
Analyzing The Exponential Moving Average
With the Bank of America chart above, we would say that the 50 day EMA is a very strong resistance level. This means that as hard as the stock tries to break through the resistance line, it experienced small failures through September and early October 2010, but from late October through the beginning of December 2010, it has experienced more severe failures. In other words, when it fails, it falls hard and fast. Based on one’s understanding of the EMA, these are some conclusions you can make for the BofA example (this may seem simplistic, but this is how the EMA is used by technical stock strategists):
- DON’T BUY Bank of America when it approaches its 50 day EMA.
- DO short sell or buy put options in BAC because it will head back down (until it finally breaks the resistance level).
- If you are watching this stock, then consider purchasing it when it closes at least two percent above its 50 day EMA. But you should still be careful.
Also notice that whenever it’s fallen, it would touch the $11 level. Given the price movements here, you stand to make a lot of money simply by playing the chart, but make sure that you have at least 5 other reasons to be a bull or bear on BAC.
Why Use Technical Analysis?
I’ve been using the 50 day exponential moving average as a way to set buy and sell levels for quite a while now and it has allowed me to belong to the group of retail investors who make a profit with their trades. Count me as part of the 20% who is currently making successful trades. It may be interesting to note how a lot of people may dismiss technical analysis as simply reading tea leaves, but given the techniques that are firmly established here, and with so many traders committed to playing by these rules, the markets themselves end up conforming to the very rules espoused by chartists and technical analysts. Since a huge bulk of the market is governed by technical traders, the market therefore behaves in the way these very traders predict they should behave. If chartists play by patterns, the market could end up behaving in more predictable ways simply because so many have decided to play by those patterns. That’s one argument for technical analysis anyway.
If you’re at all interested in participating in this sort of thing, then I would strongly recommend the use of virtual stock trading accounts, and insist that you practice first with fake money. You should first figure out if the EMA is support or resistance and set your buy or sell levels appropriately. You should be able to make some money here if you do a careful and full assessment of the stock you are interested in.
Copyright © 2010 The Digerati Life. All Rights Reserved.

{ 2 comments… read them below or add one }
I don’t personally believe that short-term timing works. But I see great value in bloggers like SVB presenting these ideas and thereby helping us all to think over the possibilities. And it may be that I am wrong about short-term timing. I’ve known a good number of very smart people who endorse it and who have made successful use of it.
I certainly agree with the idea that successful investing must combine fundamental and technical analysis. Stock prices are partly a reflection of economic realities (FA helps with this) and partly a reflection of fleeting investor emotions (TA helps with this).
Rob
I am generally against Technical Analysis. The long-term evidence of its effectiveness just isn’t there. I do believe you can beat the stock market though.
I detailed the 5 key factors that I consider in stock investments in this post.