Curious about why our savings account rates have been slumping? Ever wonder how our current economic cycle ranks among other business cycles? Economic graphs and charts reveal some trends.
Analyzing The Current Economic Cycle
I enjoy looking at historical financial charts; it gives me a chance to digest the big picture. Now that we’re formally living in a recession for some time now, do you wonder how this economic recession stacks up against all others? I’ve been curious about how this whole thing will unfold, especially since my money wants to know if it’ll still be around in a year’s time!
A while back, I wrote a post on recessions and the state of the economy, discussing the predictors and signs of economic recession, and how the recession and the stock market are linked, among its topics. I found it to be fascinating study.
This time, I stumbled on some awesome graphs by an analyst of International Economics, Paul Swartz. It gives us a look at how the current economic downturn compares to previous recessions. Although these charts don’t claim to be completely predictive, my brain can’t help but try to project the future from what we see here. What I found most interesting is this one glaring point that differentiates the 2008 recession from everything else: its cause.
Ours is a red-headed stepchild of a recession.
While past economic down cycles are typically caused by monetary tightening, the one we have now was triggered by imbalances in our financial system due to credit system woes and a swinging pendulum of overextensions then overcorrections in the markets. The hiccups in our financial system now are due to overreactions in the markets and financial institutions, consequences of the massive hangover that follows unchecked booms. Things were unregulated for sometime, with financiers, investors, money lenders… even consumers, showing great disrespect towards investment risk.
I liken it to what happens in nature: think super volcano, or mega earthquake. We’re bound to feel tremors and aftershocks for a long time.
Business Cycles Portrayed In Cool Charts
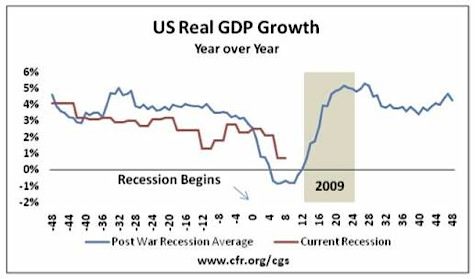
Here’s a subset of those charts (or graphs) I came across. The blue line on each chart represents the track for the average of all post WW II recessions. The red line tracks the 2008 recession. The recessions begin at “0” with the gray section corresponding to the recessionary period that lines up with our current year, 2009.
US Real GDP Growth
~~ooOoo~~
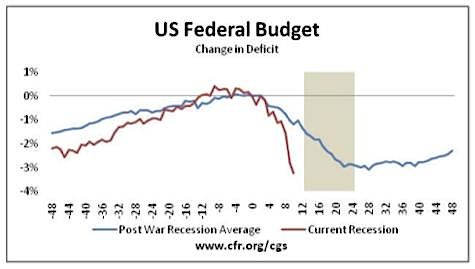
US Federal Budget
Now and going forward, you can blame the economic stimulus and financial bailouts for the deterioration in the Federal Budget.
~~ooOoo~~
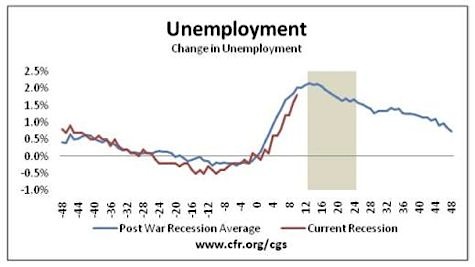
Unemployment
Job losses look like they’re in lock step with the numbers from past recessions… so far.
~~ooOoo~~
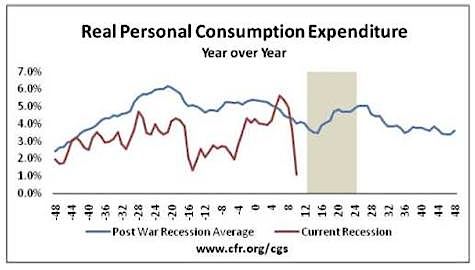
Consumer Spending
It’s interesting to see consumers holding back their spending this time, maybe as they anticipate developments in their financial future?
~~ooOoo~~
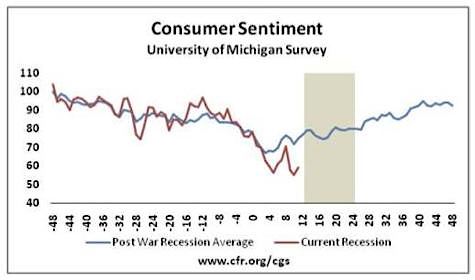
Consumer Sentiment
People are clearly anxious about their financial status, more so now than they’ve ever been.
~~ooOoo~~
Interest Rates
Most telling is how our economy’s troubled status did not arise from changes in monetary policy (or a rise in interest rates). You can see here how the Fed is being proactive about managing this recession with swifter and deeper rate cuts than usual. If our situation adheres to the trends, then rates look like they can easily go lower.

~~ooOoo~~
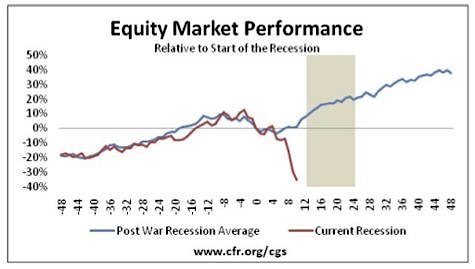
Stock Market Performance
You can see how the stock market has tanked disastrously, relative to past recessions. I hope this is an overreaction that spells great opportunity!
~~ooOoo~~
Other Findings From Economic Graphs and Trends
The following discussion pertains to the rest of the charts in this report.
Other findings show that manufacturing numbers are quite negative, with a deep contraction predicted for the manufacturing sector. Vehicle sales and oil prices show a larger slump than usual as well. During “normal” recessions, vehicle sales normally slide by 20%; this time around, they’re down by 30%. Also, the behavior of oil prices bucks previous oil pricing trends, with prices way below the norm for a recession.
Lastly, if you take a look at the corporate debt indicators (via what’s called the “investment grade debt spread” and other measures of debt spreads), you’ll see that these indicators are showing an “unprecedented” rise in the risk of defaults by corporate bonds. What is this investment grade debt spread? The Wikipedia’s definition:
The difference between rates for first-class government bonds and investment-grade bonds is called investment grade spread. It is an indicator for the market’s belief in the stability of the economy. The higher these investment grade spreads (or risk premiums) are, the weaker the economy is considered.
With the spreads higher than they’ve ever been, I suppose this points to a pretty unstable and terribly weak economy. I guess this is what happens when we let a good thing go on for too long (re: the peak of subprime lending and the real estate bubble). In the case of economies and investment markets, too much of a good thing can hurt!
Copyright © 2009 The Digerati Life. All Rights Reserved.

{ 19 comments… read them below or add one }
You might want to take a look at the book The Wall Street Waltz written by Ken Fisher maybe 20 years ago but has currently been republished/updated. The book has all sorts of charts and cycles in it dating back throughout our history.
Awesome post!
Do you think interest rates are going to skyrocket once the economy starts to pick back up? Since the Fed has poured billions into the economy when things recover it seems like we might have high inflation which in turn would lead to high mortgage rates. I have seen a few people predicting 13-15% mortgage rates in 3 years.
Did you see the op-ed by Paul Krugman in the NY Times on Jan. 4? It’s called “Fighting off Depression” and in it he makes alot of interesting comparisons between today’s conditions and those before the Depression. It’s not reassuring.
This is really useful to me and probably to my Special Bulletin readers too. Is there any chance you know how Japan pulled itself out of its last bad recession where real estate prices dropped significantly?
Interesting charts – hmmm . . .
Wondering where this economy is going?
I like the one about the equity markets performance. It looks like the present situation closely matched history and suddenly took a dive. If this is the pendulum overswinging, this may be the best opportunity of our lifetime!
It would be great if you could dig a little deeper into this.
We in the the rest of the world just watch you US guys and if the DJ rebounds, the “world” declares ourselves out of recession!!!!
@SVB,
Interesting but using the average recession isn’t allowing me to determine if we are in deep doo-doo or poised for a recovery.
Perhaps a better analysis would be a direct comparison of the current rescession to the Great Depression, the 73-75 recession and the 80-82 recession, individually. Since these were all relatively severe recessions, graphical comparisons would give an idea whether this recession has overshot or is in line with more severe recessions.
Just my two cents, or one cent as my stock investments lost 50% in 2008 🙂
What about the government reaction to this recession? Has a massive deficit spending spree been attempted before? Is there any evidence at all that “stimulus” works? I mean Bush tried sending everyone $1000 bucks and that didn’t seem to work. Why are we doubling and trippling down the bet on “stimulus”?
Cool graphs. I wonder if we’re divergent from the Post WWII graphs because we are still in two wars??? It would be great if Obama ends the wars or maybe downgrades them to conflicts and our economy bounces back like they did post WWII. Lord knows we need it.
Joe
Financial markets tend to do whatever people least expect them to (by definition — since everyone invests based on what they think will happen, it’s the only outcome not priced in). So while it’s good to get an idea of how severe things could be, these won’t do much to help predict when we’ll recover.
Wow, that’s a lot of good information. Thanks for putting it together.
Thanks for all the work! I linked this from my liberal Canadian blog for reference. When the U.S. economic dog wags, Canada is usually the tail. There may be some case that this time is different (isn’t it always 😉 because our banks were leveraged much less than international counterparts (20-to-1 vs. 40-to-1, IIRC).
Anyway, we currently have a lot of weird politics going on: a Conservative minority parliament, a constitutional crisis (a coup by a left-wing coalition to any conservatives out there!), and parliament has been locked out by the Queen’s Governor General until January 26th.
The economy probably wasn’t the cause of all that, but it’s wrapped up in one big mess right now. These charts suggest to me that in some ways this is another recession (unemployment, GDP growth), but in other ways (equities, consumption) this is very different.
Very, very interesting. I can’t help but notice how consumer spending is falling dramatically faster than would be expected in a typical downturn, and that the federal budget is tanking at an alarming rate compared to average downturns as well – I guess the two are linked anyhow – government is opening the spending spigots to offset a dramatic drop in consumer spending. Thanks for sharing.
too bad i have no clue what any of this means!!
peace:D
It means that we have less money in our pockets. I know I’ll feel broke for a while longer. 😉
All very interesting and it appears that some time was spent on this. But [there is always a “but”] the question I find interesting, and seldom answered, is: What major trend changes will these being historical graphs reflect should future events be incorporated.
I suggest, not very much, the total data being too vast to register a short-time event and our current woes are merely swallowed up in the historical clutter. They show only the profile of a typical recession. Sure, the basic trends are similar but the potential of greater “valleys” is larger.
Quoting from this blog:
That quote warns us that this is not a “typical” recession.
Quote from Super Saver [01.07.09 at 8:22 pm]
The succinct question really is then “…whether this recession has overshot or is in line with more severe recessions.”
And that, to me, highlights the philosophy behind a comment made by Warren Buffet ” Its’ better to be almost right than to be totally wrong.”
We’ve already compromised the boundaries of a “typical” recession and we can’t predict accurately the future “valley” length or depth.
My conclusion? Pick equities with a stable +/- 30 year history of good dividends. Capital growth is less important and currently very risky. The “dividend” equities will retain their value [unaffected by inflation and cost a small discount to par] and produce a [generally tax free] cash flow almost equivalent to the loss of your capital growth. Once the market has bottomed these shares may be sold profitably at par and the growth [risk] investments recapitalized.
It seems you have already interpreted the data without presenting the facts first. How can I be sure your charts are correct? Where are your data sets? What math economic model are you using to reach these conclusions? For the most part, without knowing the question the answer is always false. If the data sets are incorrect then the outcome it false or made up. Where are the Facts?
Cyn,
If you clicked on the hyperlinks on the post, you’d see where the data came from. In fact, if you read my article carefully, you’d see what I said:
I stumbled on some awesome graphs by an analyst of International Economics, Paul Swartz.
Guess the data came from that guy.
I gave my own opinions based on the data I garnered from those sources. My interpretation is just one of a myriad of possible interpretations that exist. How about you give us yours?